Debugging


Debugging
- Debugging with Your Brain
- p5.js Editor
- Syntax Errors
- Runtime Errors
- Logic Errors
- Researching Errors
- Print Statements
- Developer Tools
- Debugging is Normal
- Start Small and Test Often
- Other Debugging Tips
- Get Help
You’ve now learned about the fundamentals of coding in p5.js, and now you’re writing your own code. That’s great!
No matter where you are in your coding journey, whether you’re just starting out or if you’ve been coding for years, you’re going to find yourself in situations where your code is behaving differently from what you expected. That’s totally normal! This happens to every single programmer, every single time they write code.
This tutorial introduces some approaches and tools for understanding and fixing your code, which is also called debugging.
Debugging with Your Brain
The first (and best) debugging tool is something you already have: your brain!
It can be really frustrating when you encounter a situation where your code is behaving differently from what you expected. But instead of throwing the computer out the window, try these approaches.
Be specific. What were you expecting to happen? What exactly happened instead? Don’t say something like “I wanted to draw a flower but it’s not working”. Instead, say something like “I expected a red circle to show in the upper-left corner, but instead I only see half a circle at the top.” Being more specific helps you narrow down exactly what’s happening, and later it’ll help you talk to other people about your code.
Read your code line by line. This is one of the most important skills you need to learn to be a good coder. Double check that the code you wrote is the code you meant to write, just like you’d proofread anything you were writing. Check for issues like spelling, capitalization and that you’re using the right keywords and symbols (see syntax errors below).
Use a piece of paper and a pencil to write down the value of each variable, and to draw stuff to the “screen” as you read through your code. Don’t assume you know what the code does, and take it one line at a time. Reading it out loud can help.
p5.js Editor
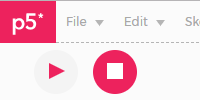
The online p5.js editor lets you write and run your code, and it comes with a few handy tools for debugging as well.
The first tool is the left margin that shows line numbers. As you write your code, if it has a syntax error (more on that in the next section), your first clue will be red highlights on any line numbers that your computer can’t understand.
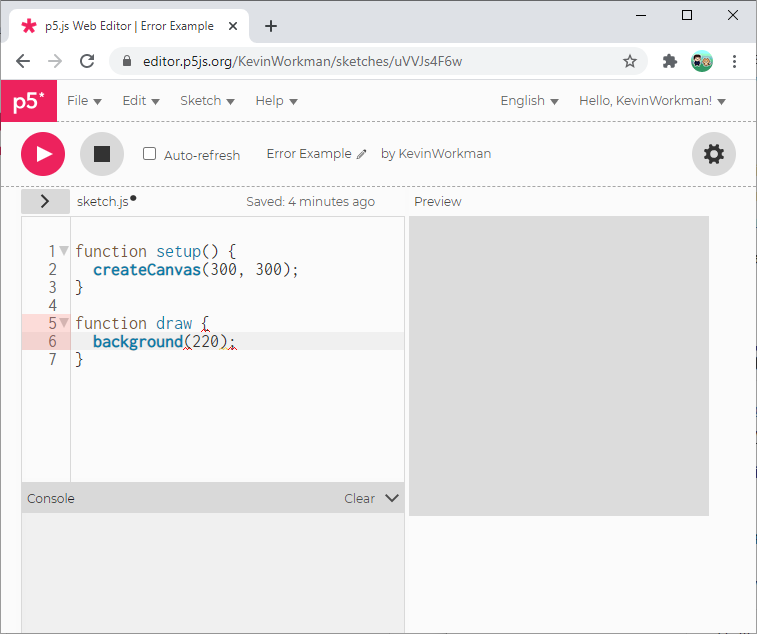
You can mouse over these highlights for more information about why your computer is confused.
The second tool is the Console that displays at the bottom of the editor. When you run your code, if it contains a syntax error or a runtime error, the error message will show up in the console.
Remember, getting errors is a normal part of coding! Next, let’s talk about different types of errors and how to figure them out.
Syntax Errors
Unlike human languages, code doesn’t leave a lot of room for mistakes. If you spell something wrong in a human language, most people will probably still understand you. But computers aren’t that smart.
Syntax is a fancy word for the keywords and symbols you can use in code. If your code only uses valid keywords and symbols in an understandable order (in other words, if your syntax is valid), then the computer will be able to understand your code. But if you use a keyword or a symbol that the computer doesn’t recognize (in other words, if your syntax is not valid), then the computer will instead give you an error.
For example, what happens if you try to run this code? Go ahead, copy it into the p5.js editor and click run!
function setup() {
  createCanvas(400, 400);
}

function draw {
  background(220);
}
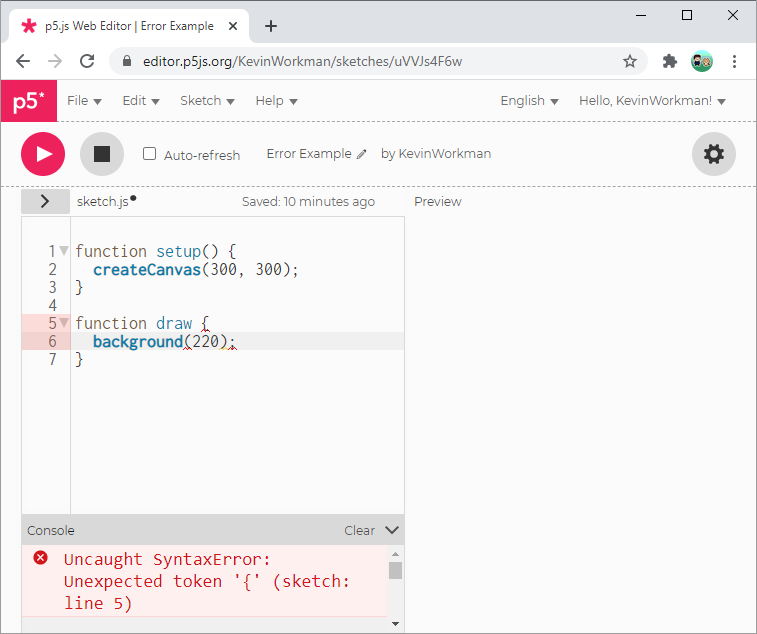
If you run this code, you’ll see an error in the console:
Uncaught SyntaxError: Unexpected token '{' (sketch: line 5)
The computer is telling you that it couldn’t understand your code. This particular error message is telling you that when it tried to read line 5 (that’s the function draw { line), it found a { character in a place where that’s not allowed.
For this specific example, the error is happening because this code is missing the parentheses () after draw. It should be this instead:
function setup() {
  createCanvas(400, 400);
}

function draw() {
  background(220);
}
Learning all of the syntax rules about a language can be pretty overwhelming when you first start coding, but over time you learn why the rules exist, which makes them easier to remember. (For example, you need () here because some functions take arguments, which go inside the parentheses!)
Runtime Errors
Even if your syntax is valid, you can still encounter errors when you run your code. These runtime errors usually happen when your code tries to do something that the computer doesn’t understand. Here’s an example:
function setup() {
  createCanvas(300, 300);
}

function draw() {
  background(myColor);
}
What do you expect happens when you run this code? Try pasting it into the p5.js and running it. You’ll see that you get an error:
Uncaught ReferenceError: myColor is not defined (sketch: line 6)
This error is telling you that the code tried to use a myColor variable on line 6, but it couldn’t find the definition for that variable.
You could fix this error by making sure the variable is defined before you use it:
let myColor = 50;

function setup() {
  createCanvas(300, 300);
}

function draw() {
  background(myColor);
}
Logic Errors
In addition to syntax and runtime errors, there’s another type of error that’s not really an error at all. We have a name for the situation when your code runs without encountering a syntax or runtime error, but still does something different from what you expected. We call this a logic error.
Logic errors are probably the most common type of error, and they’re usually caused by a typo or by an incorrect assumption about how something works. In other words, logic errors happen when there’s a problem in the logic in your code.
The frustrating thing about computers is that they do exactly what you tell them to, even if what you told them to do didn’t make sense, or wasn’t what you actually intended. So it’s up to you to make sure your code is telling the computer exactly what you want it to do.
Here’s an example:
let circleX;
let circleY;

function setup() {
  circleX = width / 2;
  circleY = height / 2;
  createCanvas(300, 300);
}

function draw() {
  background(50);
  circle(circleX, circleY, 100);
}
Read through this code line by line and try to guess what it’ll do when you run it.
You might expect it to draw a circle in the middle of the screen since it’s using width / 2 and height / 2 to find the center. But if you run it, you’ll see something like this:
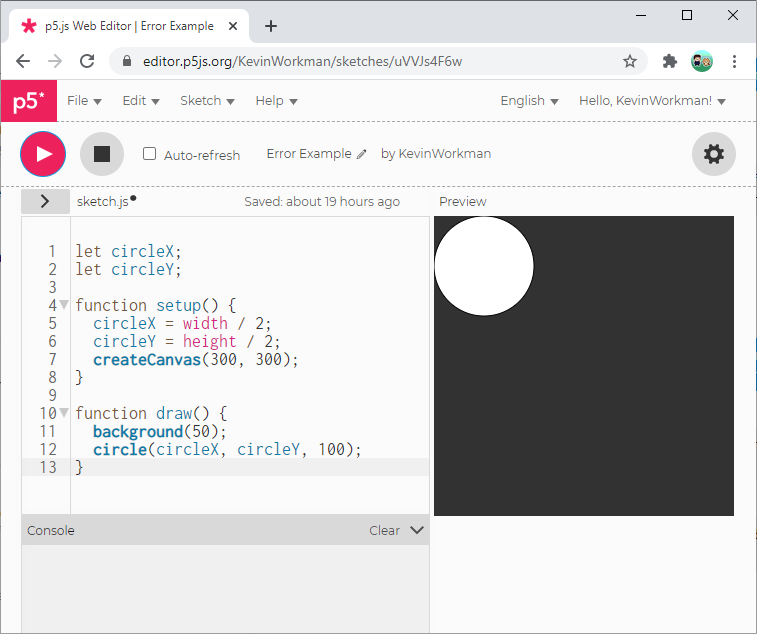
Instead of showing a circle in the middle of the screen, the circle shows up in the upper-left corner. This isn’t a syntax error or a runtime error, but there’s a logic error in the code. What’s going on?
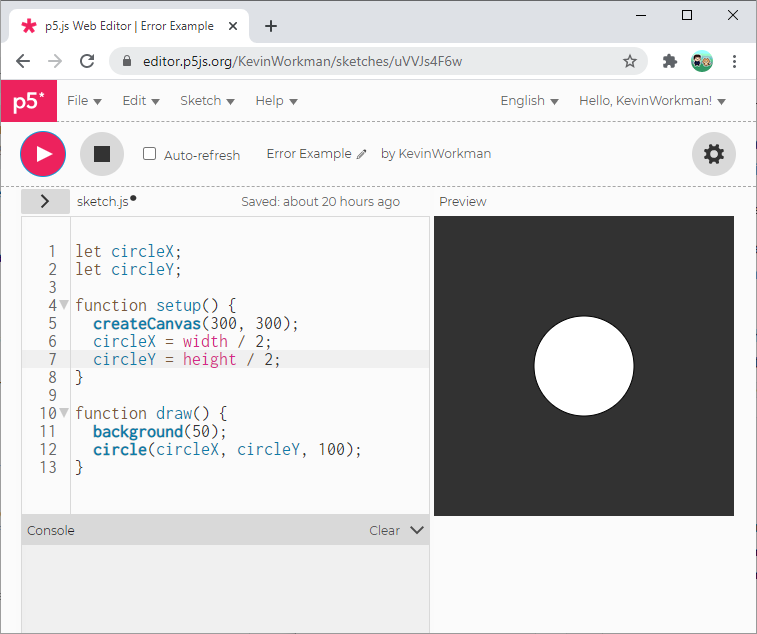
In this case, it’s because the code is calculating the circleX and circleY variables before the canvas is created. If you’re using width and height, that code needs to be after the call to createCanvas():
let circleX;
let circleY;

function setup() {
  createCanvas(300, 300);
  circleX = width / 2;
  circleY = height / 2;
}

function draw() {
  background(50);
  circle(circleX, circleY, 100);
}
Researching Errors
So far you’ve seen a couple example errors, but there are many different kinds of syntax and runtime errors. What should you do when you encounter an error you’ve never seen before, or an error you don’t understand?
The first thing you should do is take a step back and ask yourself what you expected to happen, and what happened instead. Try to be as specific as possible. What error message are you getting? What line did the error happen on? What did you expect your code to do? What exactly did it do instead?
Read the error message and try to understand what it’s telling you. Error messages can be a little cryptic at first, but they often tell you exactly what’s going wrong.
Search for the error message or for the unexpected behavior. Paste the error message into google. Try to find posts on Stack Overflow, the Processing forums, or other websites that mention your error, and read through those to get a better understanding of what’s going on.
Sometimes it can help to search for only parts of the error message. For example, if the error message mentions a variable name that you created, try leaving that variable name out of your search and only including the rest of the error message. You can also wrap the error message in " " quotation marks to look for an exact match. You can also add “p5.js” or “JavaScript” to your search for more specific results.
Doing this type of research is, again, totally normal! Writing code is one part of the process, but debugging, researching, and reading through documentation are just as important.
Print Statements
Another tool that can help you understand why your code is behaving differently from what you expected is the console.log() function.
The console.log() function prints whatever you pass into it to the console. Try running this code and then looking in the console:
function setup() {
  createCanvas(300, 300);
}

function draw() {
  background(200);

  console.log(frameCount);
}
This code prints the value of the frameCount variable to the console. The frameCount variable holds how many frames have elapsed since the start of the sketch, so you should see an increasing number in the console.
The console.log() function can also help with debugging. For example, let’s say you were still trying to figure out why this code draws a circle in the wrong place:
let circleX;
let circleY;

function setup() {
  circleX = width / 2;
  circleY = height / 2;
  createCanvas(300, 300);
}

function draw() {
  background(50);
  circle(circleX, circleY, 100);
}
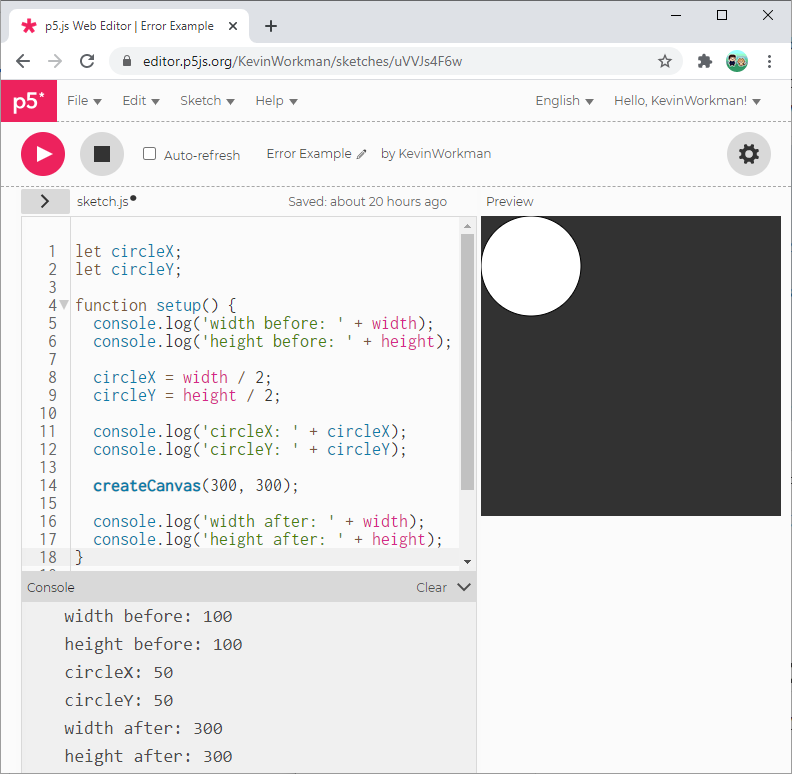
If you weren’t sure what was going on, you could add a few calls to console.log() to check your assumptions.
let circleX;
let circleY;

function setup() {
  console.log('width before: ' + width);
  console.log('height before: ' + height);

  circleX = width / 2;
  circleY = height / 2;

  console.log('circleX: ' + circleX);
  console.log('circleY: ' + circleY);

  createCanvas(300, 300);

  console.log('width after: ' + width);
  console.log('height after: ' + height);
}

function draw() {
  background(50);
  circle(circleX, circleY, 100);
}
Now when you run the code, the values of the variables are printed to the console, which can help you understand exactly what the code is doing.
You can use console.log() statements to figure out the values of variables, which functions are being called in what order, how many times a loop is iterating, etc.
Developer Tools
The p5.js editor’s console is very useful, and it’s the first place you should look when you encounter an error.
But p5.js runs in your browser, so you should become familiar with the more advanced developer tools that come with your browser. These developer tools will work even if you aren’t using the p5.js editor, and offer more functionality that will become more useful as you learn more.
You can open the developer tools of most browsers by pressing the F12 key or ctrl + shift + i, or you can find it in the menu.
- Chrome: Menu > More tools > Developer tools (show me)
- Firefox: Menu > Developer > Toggle Tools (show me)
- Internet Explorer: Menu > F12 Developer Tools (show me)
The developer tools contain a few tabs, each of which has a ton of info.
Elementsshows you the HTML of the page, and you can even click to edit the HTML and CSS. This becomes really handy when you get into web development.Consoleis very similar to the p5.js editor console. It’s where errors show up, as well as your log statements.Sourcesshows the various JavaScript files loaded by the page, and it even contains a JavaScript debugger that lets you step through your code line by line.Networkshows you all of the requests sent when you load a page, and lets you simulate different kinds of network connections.
These are the features you’ll use most often, but there a ton of features in your developer tools. Don’t be afraid to click around and check them out!
You can actually open your developer tools for any webpage in your browser. Try opening them right now and clicking around.
Debugging is Normal
I’ve said this a few times already, but I can’t repeat it enough: getting errors is a normal part of coding! Errors can be frustrating, but they don’t mean you’re doing anything wrong. So try not to let them discourage you!
A lot of online tutorials and classes show you “the happy path” of programming: you start with a goal, you write some code, and your code works! The end.
But that’s never how it works in real life. In real life, you often start with a very fuzzy goal that you need to break down into smaller pieces. Then you need to figure out what code to write for each piece, and when you try to write it, it never works how you expect it to. So you have to do more research, debug your errors, and keep chipping away at it.
I’m not saying that to discourage you. My goal is to show you that encountering errors and feeling frustrated is a totally normal part of coding! We all experience these feelings all the time. It doesn’t mean you’re bad at coding. In fact, it means you’re a coder! Welcome to the club.
Start Small and Test Often
One final tip I’ll leave you with is to start small and test often. If you try to write your whole program at once and then only run it when you’re done, you’re guaranteed to get a ton of errors.
Instead, test your code by running it and checking that it’s doing what you expected as often as you can. It’s not unreasonable to re-run your code after every line you write. Don’t wait until you think your code is done! Test that each line is doing what you expected. Use print statements to check the value of variables.
It’s much easier to debug an error when you know it’s on the line of code you just wrote. It’s a lot harder if you wait until you have dozens of lines of code to debug!
Another tactic you can use when you encounter an error or an unexpected behavior is to isolate the code that’s confusing you. Start with a new sketch and only add code that’s directly related to the problem. Code that focuses on the problem is much easier to debug than an entire program that includes a bunch of unrelated code. On the internet, you might hear these isolated programs called an MCVE or an SSCCE.
For example, if your code loads 100 images, gives them random positions and speeds, and has them all bouncing off each other, but you can’t get the bouncing to work right, then you should start with a simpler sketch:
- Instead of images, use rectangles.
- Instead of showing 100 of them, only show 2 of them.
- Instead of giving them random positions and speeds, use hard-coded values.
This small example program should still show the same problem as your main sketch. But now it’s much easier to debug, because you don’t have to look at any of the code that has nothing to do with the problem.
Half the time you’ll figure out your problem while trying to narrow your problem down to a smaller example sketch.
Other Debugging Tips
All of the above approaches will help you debug your code, but ‘d be remiss if I didn’t mention a couple other debugging tactics!
Rubber Duck Debugging
Another really useful approach for debugging is to try explaining your problem out loud. You don’t even have to be talking to another person! A rubber duck will do just fine. 🦆
Rubber duck debugging is the process of explaining your problem to an inanimate object (or a pet, or a houseplant). By restating your problem in your own words, you force your brain to think about it from a different perspective. This often gives you that “ah-ha!” moment that helps you figure out your problem. (This is also why you’ll often figure out your problem when you start writing a question to post in a forum or on Stack Overflow.)
You can learn more about rubber duck debugging here and here.
Take a Break
If you’re stuck on a particularly confusing piece of code, one of the best things you can do is get away from the computer. Go on a walk, pet your cat, and try to clear your head. You’ll be amazed at how many solutions you end up thinking of in the shower.
Get Help
You aren’t alone! If you’re still having trouble with an error or with code that’s doing something different from what you expected, you can reach out for help!
Try to isolate your problem to a small example program and come say hello on the Happy Coding forum!