Stack Overflow Data Visualization


Stack Overflow Data Visualization
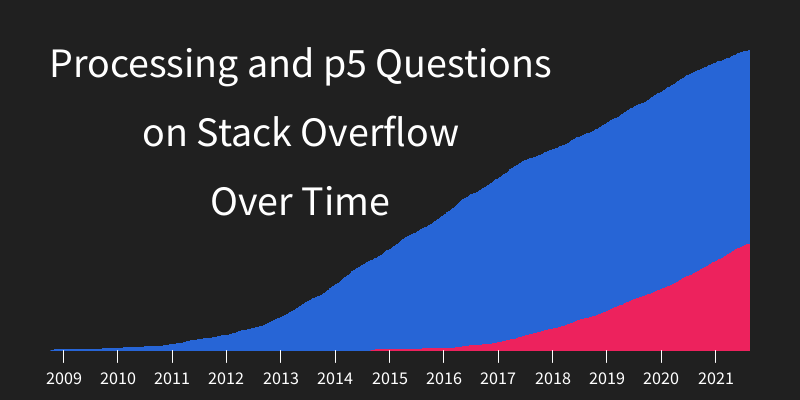
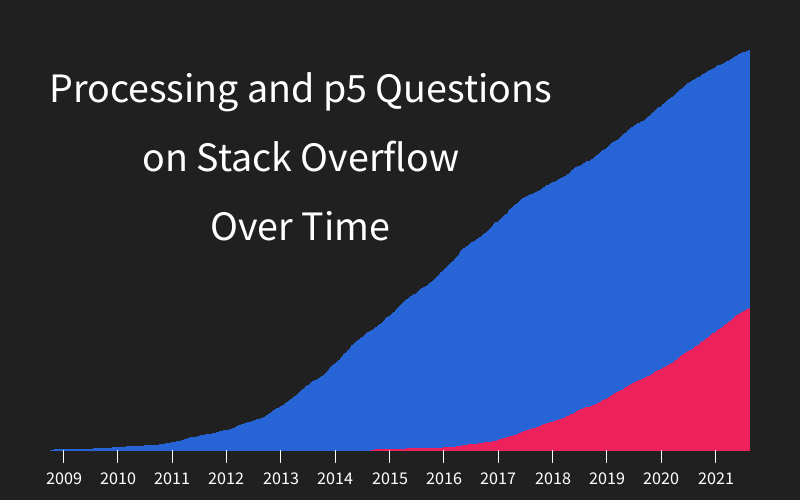
To celebrate Processing’s 20th anniversary, I decided to use Processing to visualize how many questions have been asked in the Processing and p5.js tags on Stack Overflow.
Answering questions on Stack Overflow was a big part of how I became involved in the Processing and p5.js communities, so it was cool to use Processing itself to visualize this journey.
I split this into three parts:
Part 1: Download Processing
Processing 4.0 was released just a few days before I created this data visualization, so I was excited to try it out!
Part 2: Massage the Data
“Massaging the data” means taking data that’s in one format, and converting it to a different format that’s easier to work with.
In this case, I fetched data from the questions endpoint of the Stack Overflow API and converted it to an array of timestamps.
The converter code ended up looking like this:
import java.io.InputStreamReader;
import java.nio.charset.StandardCharsets;
import java.net.HttpURLConnection;
import java.net.URL;
import java.util.zip.GZIPInputStream;
import java.util.stream.Collectors;

void setup() {
  try {
    JSONArray dates = new JSONArray();

    boolean hasMore = true;
    int currentPage = 1;

    while (hasMore) {
      println("Fetching page: " + currentPage);

      String text = getUrlContent(currentPage);
      JSONObject top = parseJSONObject(text);
      JSONArray itemsArray = top.getJSONArray("items");
      ArrayList<Integer> pageList = convertJsonArrayToDates(itemsArray);
      for (int date : pageList) {
        dates.append(date);
      }

      hasMore = top.getBoolean("has_more");
      currentPage++;
    }

    println(dates.size());

    saveJSONArray(dates, "processing-questions.json");
  }
  catch(Exception e) {
    e.printStackTrace();
  }
}

ArrayList<Integer> convertJsonArrayToDates(JSONArray input) {
  ArrayList<Integer> list = new ArrayList<>();

  for (int i = 0; i < input.size(); i++) {
    int date = input.getJSONObject(i).getInt("creation_date");
    list.add(date);
  }

  return list;
}

String getUrlContent(int currentPage) throws Exception {

  String href = "https://api.stackexchange.com/2.3/questions?pagesize=100&order=asc&sort=creation&tagged=processing&site=stackoverflow";
  href += "&page=" + currentPage;

  URL url = new URL(href);
  HttpURLConnection connection = (HttpURLConnection) url.openConnection();
  connection.setRequestProperty("Accept-Encoding", "DEFLATE");

  String text = new BufferedReader(
    new InputStreamReader(new GZIPInputStream(connection.getInputStream()), StandardCharsets.UTF_8))
    .lines()
    .collect(Collectors.joining("\n"));

  return text;
}
This “middle step” of massaging the data is very common in projects like this, but it’s not often shown. I got pretty sidetracked debugging a problem related to encoding, but I eventually figured it out. The code might not be pretty, but it works!
Part 3: Visualize the Data
Now that I had the data file(s) in a format that I could work with, I wrote code that used the data to draw a chart. The code ended up looking like this:
JSONArray processingQuestions;
JSONArray p5Questions;

int currentProcessingIndex = 1;
int currentP5Index = 1;

PGraphics processingPG;
PGraphics p5PG;

int firstDate;
int lastDate;
float totalDuration;

float border = 50;
float chartXPixels;
float chartYPixels;
float chartWidthPixels;
float chartHeightPixels;

float currentProcessingLineHeight = 0;
float currentP5LineHeight = 0;
float oneQuestionHeight;

HashMap<Integer, String> labelMap = new HashMap<>();

void setup() {
  size(800, 500);
  processingPG = createGraphics(width, height);
  p5PG = createGraphics(width, height);

  textAlign(CENTER, CENTER);

  processingQuestions = loadJSONArray("processing-questions.json");
  p5Questions = loadJSONArray("p5-questions.json");

  firstDate = processingQuestions.getInt(0);
  lastDate = max(processingQuestions.getInt(processingQuestions.size() - 1),
    p5Questions.getInt(p5Questions.size() - 1));

  totalDuration = lastDate - firstDate;

  chartXPixels = border;
  chartYPixels = border;
  chartWidthPixels = width - border * 2;
  chartHeightPixels = height - border * 2;
  oneQuestionHeight = chartHeightPixels / processingQuestions.size();

  labelMap.put(1230796800, "2009");
  labelMap.put(1262332800, "2010");
  labelMap.put(1293868800, "2011");
  labelMap.put(1325404800, "2012");
  labelMap.put(1357027200, "2013");
  labelMap.put(1388563200, "2014");
  labelMap.put(1420099200, "2015");
  labelMap.put(1451635200, "2016");
  labelMap.put(1483257600, "2017");
  labelMap.put(1514793600, "2018");
  labelMap.put(1546329600, "2019");
  labelMap.put(1577865600, "2020");
  labelMap.put(1609488000, "2021");
}

void draw() {
  background(32);
  image(processingPG, 0, 0);
  image(p5PG, 0, 0);

  fill(255);
  textSize(42);
  text("Processing and p5 Questions\non Stack Overflow\nOver Time", 300, 150);

  processingPG.beginDraw();
  p5PG.beginDraw();
  for (int i = 0; i < 10; i++) {
    int currentProcessingDate = currentProcessingIndex < processingQuestions.size() ?
      processingQuestions.getInt(currentProcessingIndex) : 0;
    int currentP5Date = currentP5Index < p5Questions.size() ?
      p5Questions.getInt(currentP5Index) : 0;

    if ((currentProcessingDate > 0 && currentProcessingDate < currentP5Date)
      || currentP5Date == 0) {
      stepProcessing();
    } else {
      stepP5();
    }

    if (currentProcessingIndex >= processingQuestions.size() &&
      currentP5Index >= p5Questions.size()) {
      println("Done!");
      noLoop();
      break;
    }
  }
  processingPG.endDraw();
  p5PG.endDraw();

  textSize(18);
  for (Integer date : labelMap.keySet()) {
    PVector labelPoint = getPoint(date, 0);

    stroke(255);
    line(labelPoint.x, height - border,
      labelPoint.x, height - border * .75);

    fill(255);
    text(labelMap.get(date), labelPoint.x, height - border / 2);
  }

  //saveFrame("f/#####.png");
}

void stepProcessing() {
  int prevDate =  processingQuestions.getInt(currentProcessingIndex - 1);
  int currentDate = processingQuestions.getInt(currentProcessingIndex);

  PVector prevPoint = getPoint(prevDate, currentProcessingLineHeight);
  PVector currentPoint = getPoint(currentDate, currentProcessingLineHeight);

  processingPG.stroke(39, 101, 214);
  processingPG.fill(39, 101, 214);
  processingPG.quad(
    prevPoint.x, height - border,
    prevPoint.x, prevPoint.y,
    currentPoint.x, currentPoint.y,
    currentPoint.x, height-border
    );

  currentProcessingLineHeight += oneQuestionHeight;

  currentProcessingIndex++;
}

void stepP5() {
  int prevDate =  p5Questions.getInt(currentP5Index - 1);
  int currentDate = p5Questions.getInt(currentP5Index);

  PVector prevPoint = getPoint(prevDate, currentP5LineHeight);
  PVector currentPoint = getPoint(currentDate, currentP5LineHeight);

  p5PG.stroke(237, 34, 93);
  p5PG.fill(237, 34, 93);
  p5PG.quad(
    prevPoint.x, height - border,
    prevPoint.x, prevPoint.y,
    currentPoint.x, currentPoint.y,
    currentPoint.x, height-border
    );

  currentP5LineHeight += oneQuestionHeight;

  currentP5Index++;
}

PVector getPoint(int date, float currentLineHeight) {
  float currentDurationFromFirstDate = date - firstDate;
  float currentPercent = currentDurationFromFirstDate / totalDuration;

  float x = lerp(chartXPixels, width - border, currentPercent);
  float y = height - border - currentLineHeight;

  return new PVector(x, y);
}
Some of this got a little messy when I decided to visualize p5.js data in addition to Processing data, but the idea should apply to pretty much any data visualization you implement: first you convert the data into a format you can work with, and then you write code that shows a graphical representation of that data.
In my case that’s a chart, but it could be anything you imagine!
Result
One thing I like about this project is that it shows “the middle step” of massaging the data. This is a common and crucial step in this kind of project, but it’s almost never shown. But this “middle step” was built right into Processing’s DNA from the start:
The name “Processing” is a play on the idea of sketching & creating and how that fits into one's “process,” as well as the idea of computers as machines that process information.
— Ben Fry (@ben_fry) August 13, 2021
But with that in mind, it's intended to be one tool in larger process—a means not an end in itself.
Happy birthday Processing!
Remix Ideas
- Visualize other tags on Stack Overflow: how does Java compare to JavaScript?
- Visualize not just questions, but answers as well. Can you surface questions that still need answers?
- Show how different users have answered questions over time. When will George take back his title as Processing Answer Champion?