Simple Weather Map


Simple Weather Map
- Weather data from Iowa State University Mesonet.
- Live weather refreshes every 5 minutes.
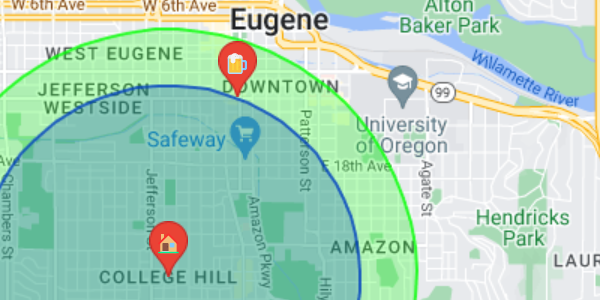
This example uses the Google Maps JavaScript library and data from the Iowa State Universitry Mesonet to create a weather map.
Here’s the source code that created this map:
<!DOCTYPE html>
<html>
<head>
  <title>Simple Weather Map</title>
  <script>
    var map;

    var currentAnimationFrame = 0;
    var animationFrames = 0;
    var animationIntervalFunctionId;

    function loadMap() {
      map = new google.maps.Map(document.getElementById('map'), {
        center: {lat: 39.7, lng: -96.2}, zoom: 4
      });
      refreshWeatherLayer();

      //weather layer refreshes at the next 5 minute mark
      var now = new Date().getTime();
      var msSinceLastFive = now % (5*60*1000);
      var msUntilNextFive = (5*60*1000) - msSinceLastFive;
      setTimeout(function(){
        refreshWeatherLayer();
        //refresh again in 5 minutes
        setInterval(refreshWeatherLayer, 5*60*1000);
      }, msUntilNextFive + 10*100);
    }

    //probably a smarter way to format dates
    function getDateString(date){

      var year = date.getUTCFullYear();
      var month = date.getUTCMonth()+1;
      if(month < 10){
        month = "0" + month;
      }
      var day = date.getUTCDate();
      if(day < 10){
        day = "0" + day;
      }
      var hour = date.getUTCHours();
      if(hour < 10){
        hour = "0" + hour;
      }
      //the weather api only gives us weather at 5 minutes marks, round down
      var minute = date.getUTCMinutes();
      minute = minute - (minute%5);
      if(minute < 10){
        minute = "0" + minute;
      }

      return year.toString()+month.toString()+day.toString()+hour.toString()+minute.toString();
    }

    function refreshWeatherLayer(){
      var animateWeather = document.getElementById("animateWeatherCheckBox").checked;
      var weatherAnimationPastFrameCount = 24;
      var weatherAnimationInterval = 100;

      setWeather(animateWeather, weatherAnimationPastFrameCount, weatherAnimationInterval);
    }

    function setWeather(animate, weatherAnimationPastFrameCount, weatherAnimationInterval){

      if(animationIntervalFunctionId){
        clearInterval(animationIntervalFunctionId);
      }

      //remove previous overlays
      map.overlayMapTypes.clear();

      if(animate){
        var baseDate = new Date();

        var i = 0;
        for(var index = -weatherAnimationPastFrameCount; index <= 0; index++){
          var frameDate = new Date(baseDate.getTime() + index * 5 * 60 * 1000);
          var frameWeatherString = getDateString(frameDate);
          addWeatherFrame(i, frameWeatherString, 0);
          i++;
        }
        animationFrames = i;
        animationIntervalFunctionId = setInterval(incrementAnimationFrame, weatherAnimationInterval);
      }
      else{
        addWeatherFrame(0, getDateString(new Date()), 1);
      }
    }

    function addWeatherFrame(index, frameWeatherDate, frameOpacity){

      var frame = new google.maps.ImageMapType({
        getTileUrl: function(coord, zoom) {
          return "http://mesonet.agron.iastate.edu/cache/tile.py/1.0.0/ridge::USCOMP-N0Q-" + frameWeatherDate + "/" + zoom + "/" + coord.x + "/" + coord.y + ".png";
        },
        tileSize: new google.maps.Size(256, 256),
        opacity:frameOpacity,
        isPng: true
      });
      map.overlayMapTypes.setAt(index, frame);
    }

    function incrementAnimationFrame(){
      map.overlayMapTypes.getAt(currentAnimationFrame).setOpacity(0);
      currentAnimationFrame++;
      if(currentAnimationFrame >= animationFrames){
        currentAnimationFrame = 0;
      }
      map.overlayMapTypes.getAt(currentAnimationFrame).setOpacity(1);
    }

    function setAnimateHelpTextVisibility(){
      var animateWeather = document.getElementById("animateWeatherCheckBox").checked;
      if(animateWeather){
        document.getElementById("animateHelpText").style.display = "block";
      }
      else{
        document.getElementById("animateHelpText").style.display = "none";
      }
    }
  </script>
  <script src="https://maps.googleapis.com/maps/api/js?key=YOUR_API_KEY_HERE"></script>
</head>
<body onload="loadMap()">

  <h1>Simple Weather Map</h1>
  <div id="map" style="width:100%; height:500px;"></div>

  <div style="float:left;">
    <label style="font-size:16pt"><input type="checkbox" id="animateWeatherCheckBox" onclick="refreshWeatherLayer(); setAnimateHelpTextVisibility();" style="width:25px; height:25px;">Animate</label>
    <ul id="animateHelpText" style="display:none;">
      <li>Shows the last 2 hours in 5 minute intervals.</li>
      <li>It might take a few cycles to fully load the images.</li>
      <li>Uncheck this before moving or zooming the map.</li>
    </ul>
  </div>

  <div style="float:right;">
    <ul>
      <li>Weather data from <a href="https://mesonet.agron.iastate.edu/ogc/">Iowa State University Mesonet</a>.</li>
      <li>Live weather refreshes every 5 minutes.</li>
    </ul>
  </div>
</body>
</html>
The Iowa State Universitry Mesonet provides a tile server, which returns images containing weather data based on a date, map zoom, and coordinates.
The URL is built using this line of code:
return "http://mesonet.agron.iastate.edu/cache/tile.py/1.0.0/ridge::USCOMP-N0Q-" + frameWeatherDate + "/" + zoom + "/" + coord.x + "/" + coord.y + ".png";
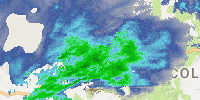
This create URLs like this one:
http://mesonet.agron.iastate.edu/cache/tile.py/1.0.0/ridge::USCOMP-N0Q-201702111735/5/9/11.png
Which returns an image that looks like this:
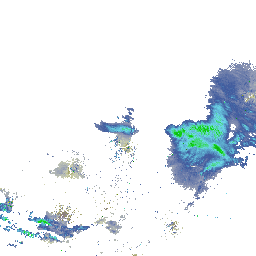
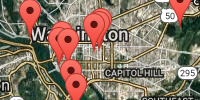
Now that we have URLs that return images based on the map zoom and coordinate, we can add a google.maps.ImageMapType layer to the map, and the map handles feeding in coordinates to build URLs whenever the map is moved, and the images are displayed on the map. Voila!
This is how we can get weather data for the entire country at different zoom levels without blowing up our computer. It’s actually how Google Maps works, too! And we can add multiple layers to the map, which is how the animation works.
Tweak Ideas
- This weather data only contains weather for the US. Find weather data for other countries and make maps for them!
- Add a weather forecast to the page.
- Visualize big weather events, like hurricanes or blizzards from the last few years.