Developer Tools


Developer Tools
- JavaScript Console
- Debugging with the JavaScript Console
- Inspect Element
- Network Tab
- Learn More
- Homework
Before you get any further into web development, you should familiarize yourself with a set of tools that you’ll be using all of the time. These are the developer tools that come with every web browser. These developer tools let you get more information about a website, to debug your JavaScript, and to see why that one element is 5 pixels to the right of where it should be.
Most browsers will be pretty similar: try pressing the F12 key, or ctrl shift i if you don’t have a F12 key, or look for it in the menu.
- Chrome: Menu > More tools > Developer tools (show me)
- Firefox: Menu > Developer > Toggle Tools (show me)
- Internet Explorer: Menu > F12 Developer Tools (show me)
This shows the developer tools panel at the bottom (or the side) of your web browser. I like to pop this into its own window by going to the menu inside the developer tools panel, then undocking it into a separate window. This way I can keep the developer tools on one screen while I work in the webpage in the other, but it’s really up to you.
Now that you have the developer tools open, let’s talk about what you’re looking at.
JavaScript Console
The Console tab shows the JavaScript console, which is your best friend when you’re writing JavaScript.
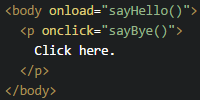
If you’ve coded even a tiny bit of JavaScript, maybe you’ve noticed that when your code breaks, most of the time nothing happens. That’s because JavaScript doesn’t show a big warning message if something goes wrong, which is good because otherwise you’d scare everybody who used your webpage! But it also can make it hard to debug your code when something goes wrong.
That’s where the JavaScript console comes in handy. Any errors your code generates will show up in the JavaScript console. So if your code isn’t working, the first thing you should do is check the JavaScript console. In fact, it’s probably a good idea to always have the JavaScript console open, because you might be getting errors you don’t even know about!
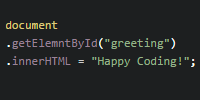
This is also where calls to the console.log() function show up. This is one of the easiest ways to debug your JavaScript code: want to know the value of a variable in your code? Print it to the console!
Debugging with the JavaScript Console
Let’s say you have this JavaScript code:
let x;
if (x > 10) {
  alert('hello!');
}
This example code might be a little obvious, but pretend you’re getting the value of the x variable from a library or from the user. Let’s say you’re expecting to see a dialog show up, but it’s not displaying. At this point, you might be tempted to say, “ugh, the alert() function isn’t working!”
But before you go to Stack Overflow or the Happy Coding forum and proclaim that you found a bug in JavaScript, you should first test your assumptions. One of the best ways to do that is to add some print statements to your code to make sure it’s executing the way you think it is.
For example, you might put a print statement inside the if statement to check whether the code reaches it:
let x;
if (x > 10) {
  console.log('inside if statement');
  alert('hello!');
}
If you run that code, you won’t see the message print to the console. That tells you that the code is not entering the if statement. Now you know that the problem is before the code even gets to the alert() function. You might add another print statement to make sure your code is running:
let x;
console.log('before if statement');
if (x > 10) {
  console.log('inside if statement');
  alert('hello!');
}
That new print statement shows up in the console, so finally you might print the value of x to make sure it’s what you thought it was:
let x;
console.log('before if statement');
console.log('x: ' + x);
if (x > 10) {
  console.log('inside if statement');
  alert('hello!');
}
This prints x: undefined to the console, which tells you that the x value is undefined! This example might have been a little obvious, but you’ll go through this same debugging process very often as you write more JavaScript code.
Inspect Element
Another handy tool is the ability to inspect an HTML element. This lets you see the layout of the page, the styles of an element, and the output of any JavaScript that changes the page.
You can inspect an element by right-clicking an element in the webpage itself, and then clicking Inspect in the menu. This will bring you to the Elements tab of the developer tools, with the element you clicked already selected.
You can use this to view an element’s CSS styles. This is really useful if you want to know exactly what’s causing an element to look a certain way. Also check out the Computed tab to show the final result of all of the cascading styles.
You can also use this to change the styles of an element, which is a good way to play with different CSS values. Refreshing the page will restore the default styles.
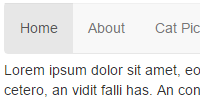
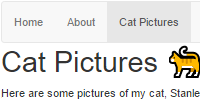
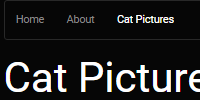
Try inspecting these elements:
I'm a paragraph. I'm a link inside that paragraph.
- List Item One
- List Item Two
- List Item Three

Try playing with the styles inside your browser’s developer tools: add borders, change the size, change background colors. This is another handy tool for debugging the layout of your page.
Network Tab
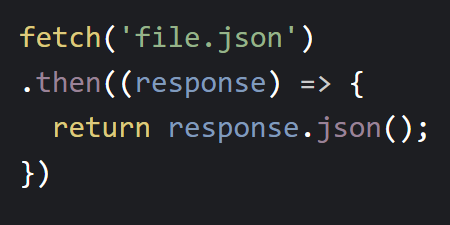
A webpage is usually multiple files: you might have one index.html file, a few .js files, some .css files, and some image files. Each of these files needs to be downloaded over the internet or fetched from your cache every time you load a webpage.
The Network tab shows all of this. Try going to the Network tab now and then refreshing the page. Check out all the files that are downloaded!
This becomes really useful if you have stuff on your page that’s not loading correctly. Maybe you have an image that isn’t showing up. Check the network tab! This will show you any errors you’re getting on individual files.
Learn More
The developer tools contain a ton more: you can test different kinds of internet connections, see what a website looks like on other devices, and even step through your JavaScript code with a debugger. Don’t be afraid to click around and experiment (and use your favorite search engine) to find out more! But the Console, Elements, and Network tabs will get you pretty far for now.
Homework
- Open up the Developer Tools and then navigate to a few of your favorite websites. Do any of them have errors? What types of files do they require?
- Play around with the CSS by inspecting elements. Don’t worry, nothing you do can break a website, so get creative! And if you want to go back to the default styles, you can refresh the page.