


Comic Book Colors
Like many bigger projects, this visualization required a few different languages and tools. Here’s a summary of the code I used to create this project.
ImageMagick
I started out with a bunch of comics in .pdf files, which I got from Image’s website here.
Then I used ImageMagick to convert those .pdf files into indivial .png files that I could then process.
magick convert Saga_vol1.pdf pages/saga-1-page-%03d.png
This gave me a .png file for each page in the comic.
Average Colors
Then I used Processing to come up with the average color of a particular .png file:
void setup() {
  size(500, 500);
  PImage image = loadImage("saga-1-page-001.png");
  color c = average(image);
  background(c);
}

color average(PImage image) {

  float r = 0;
  float g = 0;
  float b = 0;

  for (int y = 0; y < image.height; y++) {
    for (int x = 0; x < image.width; x++) {

      color pixelColor = image.get(x, y);
      r += red(pixelColor);
      g += green(pixelColor);
      b += blue(pixelColor);
    }
  }

  r /= image.width * image.height;
  g /= image.width * image.height;
  b /= image.width * image.height;

  return color(r, g, b);
}
OpenCV
Instead of implementing k-means clustering myself, I used OpenCV for Processing which let me use OpenCV’s kmeans() function.
This StackOverflow answer was super helpful, as was this GitHub repo by Mario Zechner of libGDX fame.
Clustering Colors
Note: This code is pretty hackish and wasn’t really designed for other people to read!
Here is the code that generates clusters and their respective weights:
import gab.opencv.OpenCV;
import org.opencv.core.Core;
import org.opencv.core.CvType;
import org.opencv.core.Mat;
import org.opencv.core.TermCriteria;

import java.util.Comparator;
import java.util.List;
import java.util.Map;
import java.util.Map.Entry;
import java.util.LinkedHashMap;

ArrayList<Integer> pageColors = new ArrayList<Integer>();

void setup() {
  size(400, 100);
  PImage image = loadImage("C:/Users/kevin/Desktop/comics/Saga1/pages/saga-1-page-059.png");

  OpenCV openCv = new OpenCV(this, 500, 500);

  PGraphics mg = createGraphics(400, 100);

  mg.noStroke();
  mg.noSmooth();

  mg.beginDraw();
  mg.noStroke();

  Mat m = new Mat(image.height, image.width, CvType.CV_8UC4);
  OpenCV.toCv(image, m);
  Map<Integer, Float> colorWeights = cluster(m, 4);

  float cellX = 0;
  for (color c : colorWeights.keySet()) {
    float cellWidth = width * colorWeights.get(c);
    mg.fill(c);
    mg.rect(cellX, 0, cellWidth, height);
    cellX += cellWidth;
  }

  mg.endDraw();
  image(mg, 0, 0, width, height);
}

ArrayList<Integer> convertToColors(Mat m) {
  ArrayList<Integer> colors = new ArrayList<Integer>();
  for (int i = 0; i < m.rows(); i++) {
    double r = m.get(i, 1)[0] * 255;
    double g = m.get(i, 2)[0] * 255;
    double b = m.get(i, 3)[0] * 255;
    colors.add(color((float)r, (float)g, (float)b));
  }
  return colors;
}

public Map<Integer, Float> cluster(Mat image, int k) {
  Mat samples = image.reshape(1, image.cols() * image.rows());
  Mat samples32f = new Mat();
  samples.convertTo(samples32f, CvType.CV_32F, 1.0 / 255.0);

  Mat labels = new Mat();
  TermCriteria criteria = new TermCriteria(TermCriteria.COUNT, 100, 1);
  Mat centers = new Mat();
  Core.kmeans(samples32f, k, labels, criteria, 1, Core.KMEANS_PP_CENTERS, centers);
  return getColorWeights(image, labels, centers);
}

public Map<Integer, Float> getColorWeights(Mat image, Mat labels, Mat colors) {

  Map<Integer, Float> colorTotals = new HashMap<Integer, Float>();

  int index = 0;
  for (int y = 0; y < image.rows(); y++) {
    for (int x = 0; x < image.cols(); x++) {
      int label = (int)labels.get(index, 0)[0];

      double r = colors.get(label, 1)[0]*255;
      double g = colors.get(label, 2)[0]*255;
      double b = colors.get(label, 3)[0]*255;

      color c = color((float)r, (float)g, (float)b);

      if (!colorTotals.containsKey(c)) {
        colorTotals.put(c, 0f);
      }
      colorTotals.put(c, colorTotals.get(c) + 1);

      index++;
    }
  }

  int imageSize = image.rows() * image.cols();

  List<Entry<Integer, Float>> list = new ArrayList<Entry<Integer, Float>>(colorTotals.entrySet());
  list.sort(new Comparator<Entry<Integer, Float>>() {
    public int compare(Entry<Integer, Float> eOne, Entry<Integer, Float> eTwo) {
      return eTwo.getValue().compareTo(eOne.getValue());
    }
  }
  );

  LinkedHashMap<Integer, Float> colorWeights = new LinkedHashMap<Integer, Float>();
  for (Entry<Integer, Float> entry : list) {
    colorWeights.put(entry.getKey(), entry.getValue() / imageSize);
  }

  return colorWeights;
}
Fun fact: if you cluster all of the colors into a single group, you end up with the average color!
Color Reduction
I also put together a function that took a comic page, clustered it to a certain number of colors, and then recolored the page using only those colors:
void drawReduced (Mat cutout, Mat labels, Mat centers, int k) {

  PGraphics pg = createGraphics(cutout.width(), cutout.height());
  pg.beginDraw();
  pg.noSmooth();
  int index = 0;
  for (int y = 0; y < cutout.rows(); y++) {
    for (int x = 0; x < cutout.cols(); x++) {
      int label = (int)labels.get(index, 0)[0];
      double r = centers.get(label, 1)[0]*255;
      double g = centers.get(label, 2)[0]*255;
      double b = centers.get(label, 3)[0]*255;

      pg.stroke(color((float)r, (float)g, (float)b));
      pg.point(x, y);
      index++;
    }
  }
  pg.endDraw();
  image(pg, 0, 0, width, height);
}
This was a ton of fun to play around with, but it didn’t make it into the visualization. I might work it into another project in the future…
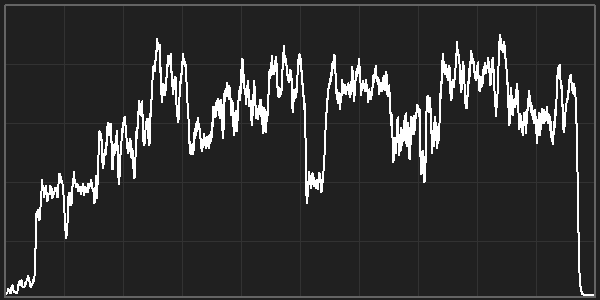
Cluster Lines
Instead of using the weights, I ended up just drawing each color as a single line.
void addClusterBarCodePage(String pageFile, int k) {
  PImage image = loadImage(pageFile);
  Mat m = new Mat(image.height, image.width, CvType.CV_8UC4);
  OpenCV.toCv(image, m);
  Map<Integer, Float> colorWeights = cluster(m, k);

  PGraphics pg = createGraphics(colorWeights.size(), height);
  pg.noSmooth();
  pg.beginDraw();

  int lineX = 0;
  for (color c : colorWeights.keySet()) {
    pg.stroke(c);
    pg.line(lineX, 0, lineX, pg.height);
    lineX++;
  }
  pg.endDraw();
  pageGraphics.add(pg);
}
Visualization
Now that I had code that handled a single page, I wrote a program that looped over the first 100 pages of a given comic and stitched together each page’s visualization to create the end result.
ArrayList<PGraphics> pageGraphics = new ArrayList<PGraphics>();

int cellWidth;
int cellHeight;

enum PageConversionMode {
  AVERAGE, WEIGHTED_CLUSTER, LINE_CLUSTER;
}

enum PageOutputMode {
  GRID, BARCODE;
}

PageConversionMode pageConversionMode = PageConversionMode.AVERAGE;
PageOutputMode pageOutputMode = PageOutputMode.GRID;

String comic = "Saga-1";

void setup() {
  size(600, 900);

  loadOpenCv();

  cellWidth = width / 10;
  cellHeight = height / 10;

  addPages("C:/Users/kevin/Desktop/comics/" + comic + "/pages");

  if (pageOutputMode == PageOutputMode.GRID) {
    drawPagesAsGrid();
  } else {
    drawPagesAsBarCode();
  }

  save(comic + "-averages-1.png");
}

void drawPagesAsGrid() {
  int pageIndex = 0;
  for (int y = 0; y < 10; y++) {
    for (int x = 0; x < 10; x++) {
      PGraphics pg = pageGraphics.get(pageIndex);
      image(pg, x*cellWidth, y*cellHeight, cellWidth, cellHeight);
      pageIndex++;

      noFill();
      noStroke();
      rect(x*cellWidth, y*cellHeight, cellWidth, cellHeight);
    }
  }
}

void drawPagesAsBarCode() {
  background(255, 0, 0);
  int pgX = 0;
  for (int i = 0; i < pageGraphics.size(); i++) {
    PGraphics pg = pageGraphics.get(i);
    image(pg, pgX, 0);
    pgX += pg.width;
  }
}

void addPages(String pageDirectory) {
  File pageDir = new File(pageDirectory);
  for (File pageFile : pageDir.listFiles()) {
    //  AVERAGE, WEIGHTED_CLUSTER, LINE_CLUSTER;
    if(pageConversionMode == PageConversionMode.AVERAGE){
      addAveragePage(pageFile.getAbsolutePath());
    }
    else if(pageConversionMode == PageConversionMode.WEIGHTED_CLUSTER){
      addClusterBarCodeWeightedPage(pageFile.getAbsolutePath(), 4, 10);
    }
    else{
      addClusterBarCodePage(pageFile.getAbsolutePath(), 4);
    }

    println(pageFile.getName());

    if (pageGraphics.size() >= 100) {
      return;
    }
  }
}
This code is pretty messy, a result of hacking different things together at different times. But I could use this to create all of the visualizations ahead of time.
Webpage
Now that I had the visualizations for each comic book, I put it all together using HTML, JavaScript, and P5.js.
var comicName = 'invincible';
var averagesImage;
var thumbnails = [];

function setup() {
  var canvas = createCanvas(400, 400);
  canvas.parent("sketch-holder");
  loadComic();
  windowResized();
  noLoop();
}

function draw() {
  background(32);
  stroke(255);
  fill(255);
  textSize(36);
  text("Loading...", width*.25, height/2);

  image(averagesImage, 0, 0, width, height);

  drawThumbnails();
}

function drawThumbnails(){
	thumbnails.forEach( (thumbImage, index) => {
			const cellIndexX = index % 10;
			const cellIndexY = int(index / 10);
			const cellWidth = width / 10;
			const cellHeight = height / 10;
			const cellX = cellIndexX * cellWidth;
			const cellY = cellIndexY * cellHeight;

			image(thumbnails[index], cellX, cellY, cellWidth, cellHeight);
	}  );
}

function mousePressed(){

	if(mouseX < 0 || mouseX > width || mouseY < 0 || mouseY > height){
		return true;
	}

	const cellWidth = width / 10;
	const cellHeight = height / 10;
	const cellX = int(mouseX/cellWidth);
	const cellY = int(mouseY/cellHeight);
	const thumbnailIndex = cellY * 10 + cellX;

	if(thumbnails[thumbnailIndex]){
	  delete thumbnails[thumbnailIndex];
	}
	else{
	  thumbnails[thumbnailIndex] = loadImage('//s3.happycoding.io/gallery/comic-book-colors/images/comics/' + comicName + '/thumbnails/' + comicName + '-thumbnail-' + thumbnailIndex.toString().padStart(3, '0') + '.png', redraw);
	}
	redraw();
	return false;
}

function windowResized(){
  var sketchHolder = select('#sketch-holder').elt;
  resizeCanvas(sketchHolder.clientWidth, sketchHolder.clientWidth * 1.5);
}

function loadComic(){
	averagesImage = loadImage('//s3.happycoding.io/gallery/comic-book-colors/images/comics/' + comicName + '/' + comicName + '-averages-1.png', redraw);

	select('#line-clusters').elt.src = '//s3.happycoding.io/gallery/comic-book-colors/images/comics/' + comicName + '/' + comicName + '-line-clusters-1.png';

	select('#name').html(comics.get(comicName).title);
}

function setComic(comic){
	comicName = comic;
	thumbnails = [];
	loadComic();
	redraw();
}
This JavaScript code is what makes the interactive tool respond to user input, changing the images when the user clicks the buttons or in the averages grid.
Ideas
All of this code is released under a Creative Commons Attribution open-source license. That means you can do whatever you want with it, just please credit a link back here so people can learn more about coding.
Here are a few ideas for how you could take this code and do something interesting:
- Generate a similar visualization for movies or TV shows.
- Create a vizualization for a webcomic.
- Change the palette of a comic: what would East of West look like with blue instead of red?
- Use the palette from one comic to color the pages of a different comic. What would Walking Dead look like with Saga’s colors?
If you come up with something cool, please post about it on the forum so I can see it!